For FOC’s Cheat River Restoration program, we often have to focus our efforts on being reactive to negative impacts to the Cheat; cleaning up after abandoned mine lands has been the meat of our restoration work for more than two decades.
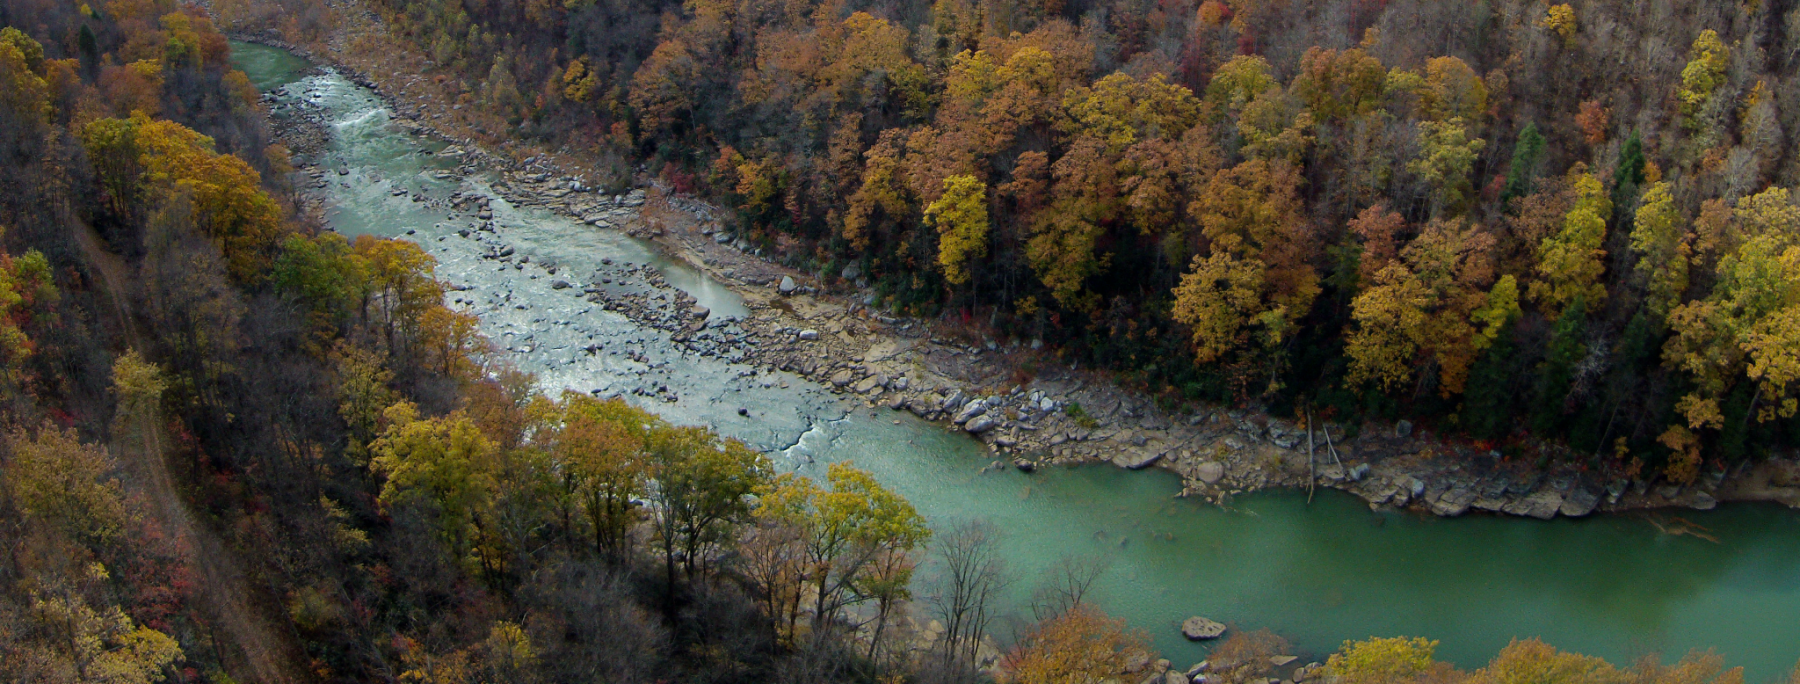
This year, however, we were given a rare and unique opportunity to be proactive in planning our restoration efforts, which was afforded to us by the NASA DEVELOP Team. We have noticed changes to the Cheat Watershed in recent years, including more frequent, monstrous rain events that have led to damaging floods, followed by periods of significant drought. During certain times of the year, sections of the Cheat look more like boulder fields than a river.
We know these conditions have serious consequences for our river communities, freshwater resources, and native species. So when NASA DEVELOP approached us to partner on a project using earth observation data and remote sensing technology, we leaped at the chance to forge FOC’s local knowledge with their expertise. We proposed a project designed to assess if the climate had changed in Preston and Tucker Counties, and if so, how these changes may lead to increased flood vulnerability. FOC’s goal with this project was to clearly identify vulnerable areas and seek restoration projects that will lead to a climate resilient river system, and therefore climate resilient communities.
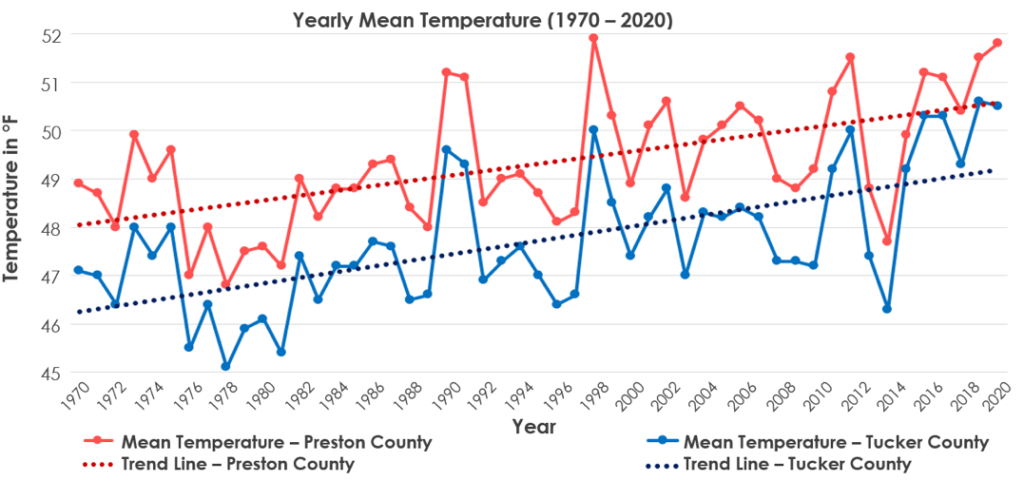
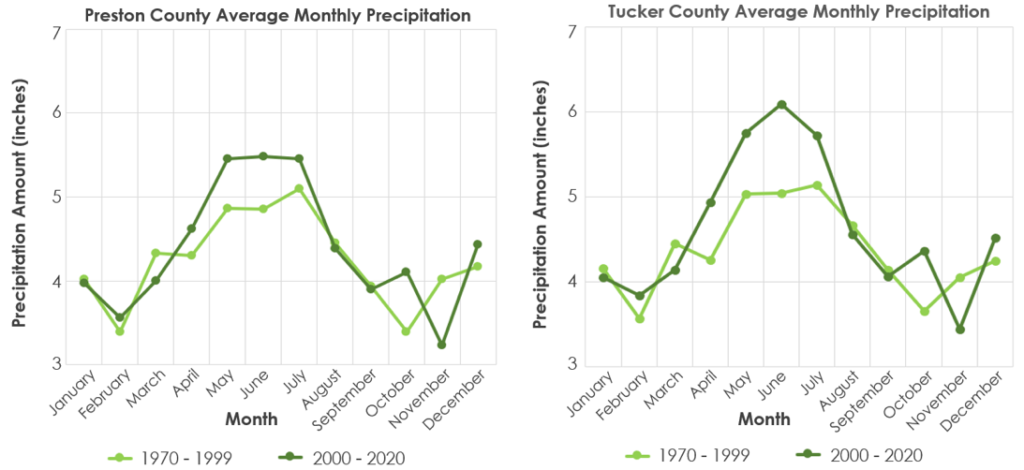
In the spring of 2021, the NASA DEVELOP Team took a deep dive into the Preston and Tucker County data and discovered that “between 1970 and 2020, temperature has increased by about 1.5°C (2.7°F), and precipitation has increased by 4.2 inches, while monthly river discharge has become more variable. At the same time, there were no detectable trends in land cover at the county level.”
The temperature and precipitation increased occurred without major land disturbance, such as increased infrastructure development, leading FOC to wonder if these effects could multiply if land cover were to change significantly over the next 50 years.
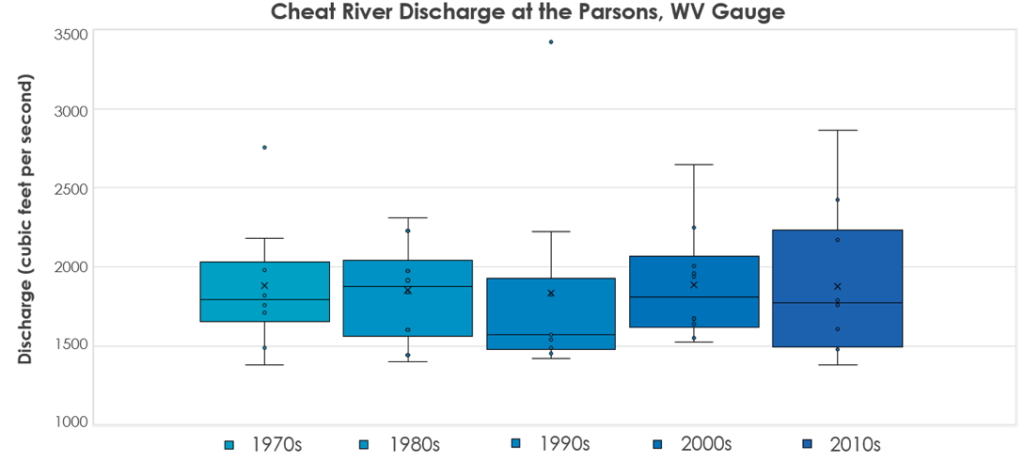
Another concern is the noted variability in river discharge, or flows, providing evidence for what we have witnessed on the ground in recent decades. In the box and whisker plots below, the dots on the plot are the average yearly values of discharge. Any dot not plotted on the box or line for the decade is an outlier.The X in the plot is the mean for the decade, while the line in the box is the median for the decade. Looking at the X’s (means) for the decades, we can see that there is a trend upward. This indicates that the average discharge per decade is increasing.
FOC was surprised that the variability for the 1980s was not higher due to the 1985 Flood– however, lower flows or more average flows recorded from other dates in the 1980s may have canceled out its effect when looking at the data as a whole from that decade. This further illustrates how widely the flow has varied in the last decade (2010s).
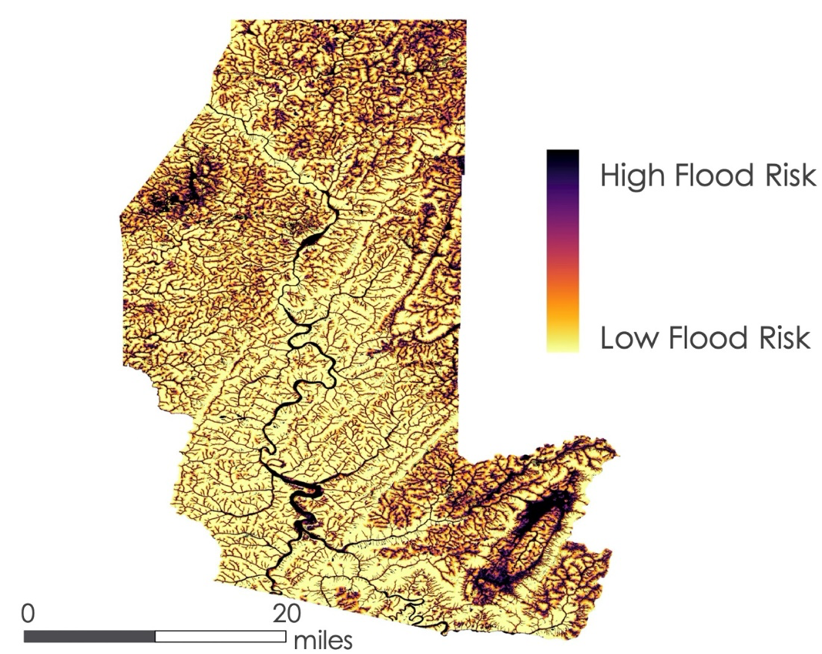
In addition to assessing climatology trends for Preston and Tucker Counties, the NASA DEVELOP Team also created a Flood Vulnerability Map of the project area.
To determine flood vulnerability, which the team defined as affecting human-made structures or human health, the team analyzed underground mine locations, road networks, and population density on the flood risk map (see Figures below).
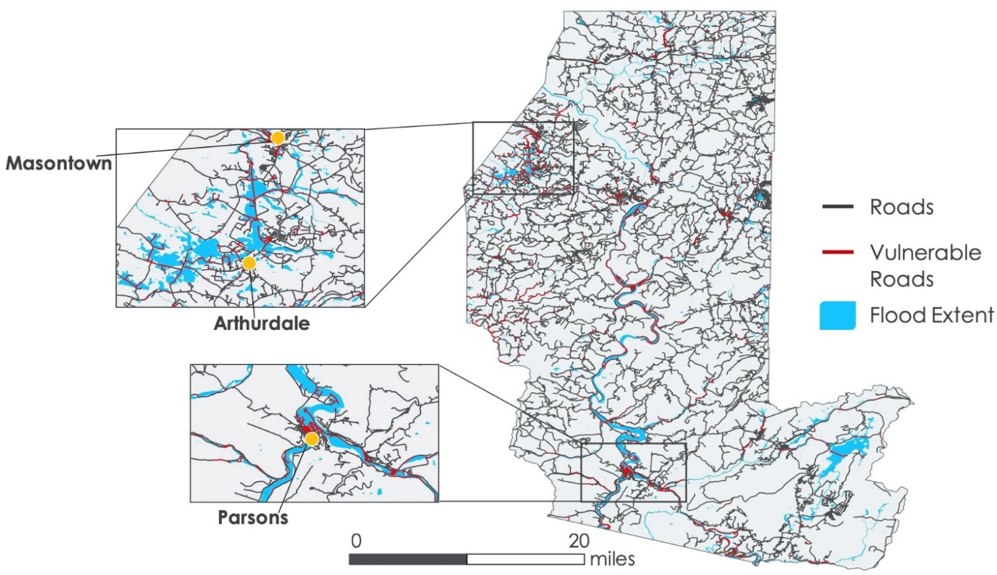
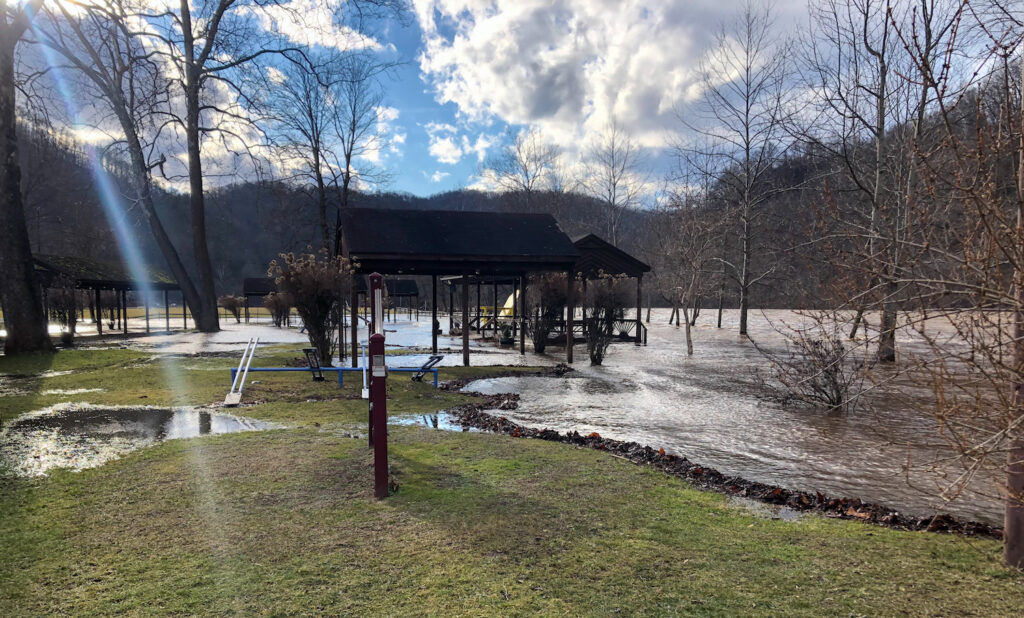
Some areas that have been flooded before, such as Parsons, were not particularly surprising, but FOC staff were surprised by the vulnerability of the Masontown and Arthurdale area. Due to the concerns about increased flooding leading to worsened water quality due to acid mine drainage, the team analyzed mine vulnerability. While there are large areas of mining in the study region, only small sections of the mines intersected with the flood extent and were considered vulnerable. Many of the vulnerable mines are located in the region of North-West Preston county (Masontown, Reedsville, and Arthurdale).
Ultimately Friends of the Cheat will use these new tools and resources to pursue projects in vulnerable areas that will improve the Cheat’s chances of remaining stable in a changing climate. Projects that will increase the Cheat’s climate and flood resilience including improving and upsizing road crossing with streams (which also can improve fish passage), reforesting riparian areas to improve stream shade and reduce erosion in flooding events, securing funds to upsize stormwater and sewage treatment systems, and adapting acid mine drainage treatment sites and projects to be able to treat seasonal high flow volumes.